What’s OpenTSDB
OpenTSDB consists of a Time Series Daemon (TSD) as well as set of command line utilities. Interaction with OpenTSDB is primarily achieved by running one or more of the TSDs. Each TSD is independent. There is no master, no shared state so you can run as many TSDs as required to handle any load you throw at it. Each TSD uses the open source database HBase or hosted Google Bigtable service to store and retrieve time-series data. The data schema is highly optimized for fast aggregations of similar time series to minimize storage space. Users of the TSD never need to access the underlying store directly. You can communicate with the TSD via a simple telnet-style protocol, an HTTP API or a simple built-in GUI. All communications happen on the same port (the TSD figures out the protocol of the client by looking at the first few bytes it receives).
看下官网给出的架构图:

重点就是基于HBase的分布式的时间序列数据库,所以非常适合做监控系统。
Grafana搭建监控
首先Grafana监控是基于Metrics打点实现的,可以参考其他的文档,这里不再赘述。
Metric :打点的tag
Aggregator :可以选择sum/average等
Alias :取名,可以通过${…}的方式获取Filters/Tags以及Variables中的变量,下面会提到
Downsampling :降采样,官方文档解释为:
Downsampling (or in signal processing, decimation) is the process of reducing the sampling rate, or resolution, of data.
其实很好理解,看下开启Downsampling前后的两张对比图:
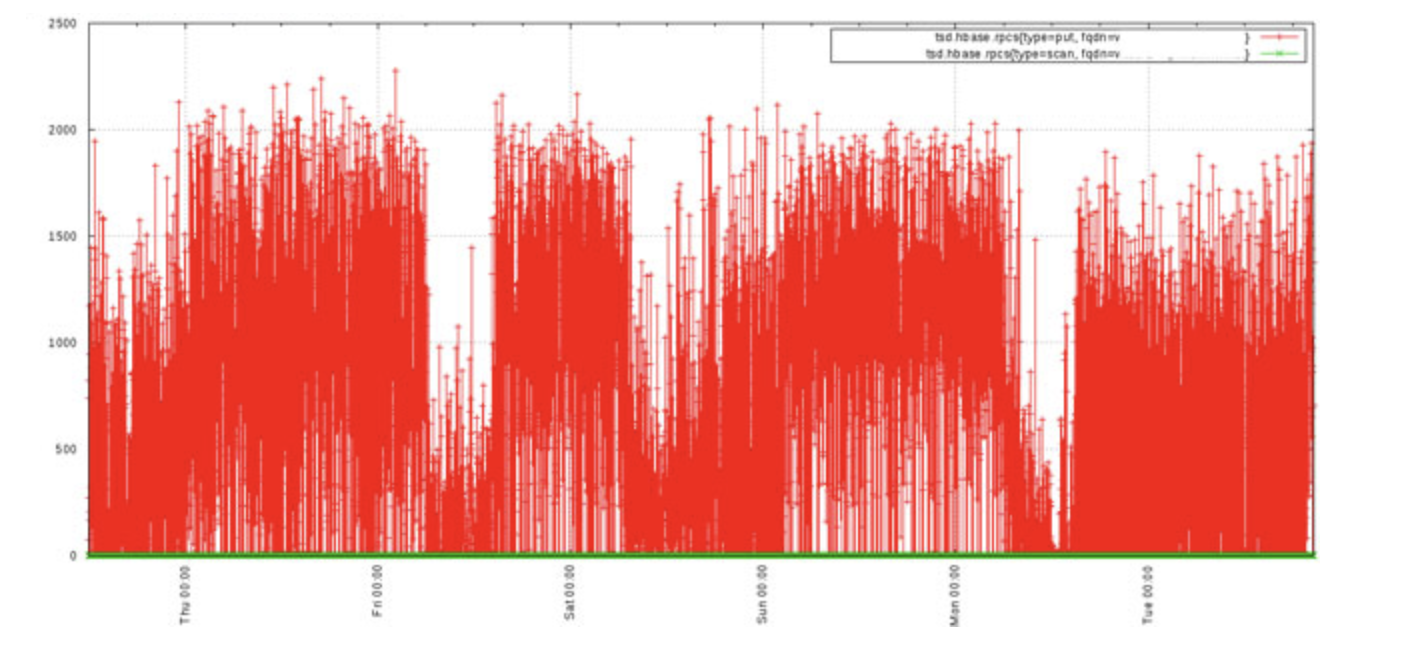
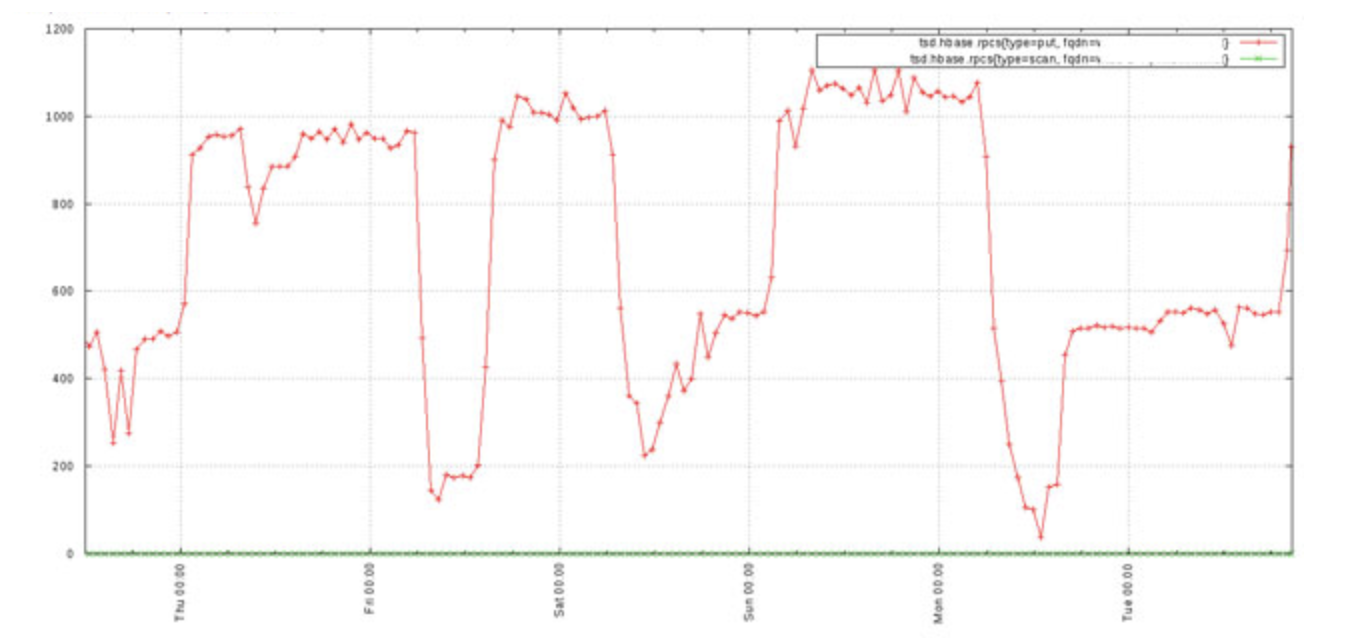
很明显,使用Downsampling之后的采样数据在降低了采样率的情况下,依然能够表现出与原采样结构较吻合的曲线走势。
Filters 和 Tags :其实这两个是类似的概念,但需要注意二者不能同时使用,并且Tags也在OpenTSDB2.2之后就deprecated了,所以我们这里使用Filters。实际上,Filters功能也的确更加丰富。
大多数情况下,我们的监控需求都可以通过Filters实现,那么下面就来详细介绍一下Filters的用法。
Filters内置的过滤器有以下几种:
literal_or
Takes a single literal value or a | pipe delimited list of values and returns any time series matching the results on a case sensitive bases. This is a very efficient filter as it can resolve the strings to UIDs and send that to the storage layer for pre-filtering. In SQL this is similar to the IN or = predicates.
Examples
host=literal_or(web01|web02|web03)In SQL:WHERE host IN ('web01', 'web02', 'web03')host=literal_or(web01)In SQL:WHERE host = 'web01'
iliteral_or
The same as a literal_or but is case insensitive. Note that this is not efficient like the literal or as it must post-process all rows from storage.
not_literal_or
Case sensitive literal_or that will return series that do NOT match the given list of values. Efficient as it can be pre-processed by storage.
not_iliteral_or
Case insensitive not_literal_or.
wildcard
Provides case sensitive postfix, prefix, infix and multi-infix filtering. The wildcard character is an asterisk (star) *. Multiple wildcards can be used. If only the asterisk is given, the filter effectively returns any time series that include the tag key (and is an efficient filter that can be pre-processed). In SQL land, this is similar to LIKE predicate with a bit more flexibility.
Examples
host=wildcard(*mysite.com)In SQL:WHERE host='%mysite.com'host=wildcard(web*)host=wildcard(web*mysite.com)host=wildcard(web*mysite*)host=wildcard(*)This is equivalent to the v1 basic group by operator and is efficient.
iwildcard
The same as wildcard but case insensitive.
regexp
Filters using POSIX compliant regular expressions post fetching from storage. The filter uses Java’s built-in regular expression operation. Be careful to escape special characters depending on the query method used.
Examples
regexp(web.*)In SQL:WHERE host REGEXP 'web.*'regexp(web[0-9].mysite.com)
总结一下,大多数情况下使用literal_or/not_literal_or/wildcard即可,并且这样也效率更高。有忽略大小写的需求以及支持正则表达式的需求可以使用剩下的几种。
这里还有一个很细的点,v2.1即之前只有 | 和 * 可用,区别在于:
In the original OpenTSDB release and up to 2.1, only two types of filters were available and they were implicitly configured for grouping. The two operators allowed were:
- ***** - The asterisk (or wildcard) will return a separate result for each unique tag value detected. E.g. if the tag key
hostwas paired withweb01andweb02then there would be two groups emitted, one onweb01and one onweb02.- | - The pipe (or literal_or) will return a separate result only for the exact tag values specified. I.e. it will match only time series with the given tag value and group on each of those matches.
Multiple filters can be provided per query and the results are always ANDed together. These filters are still available for use in 2.x and later.
我的理解里大概意思是,* 占位符会为每种结果单独统计,而 | 的使用将会将所有可能取值聚合在一起。(不知道对不对)
了解完这些之后,基本就能满足我们的过滤需求了,那么我们可以通过${…}的方式让Alias更加直观。有这么两种方式:
- 通过Filters中的Key直接指定,例如
${tag_country}指代country的取值。需要注意的是,这种方法在使用Filters时,只有当groupBy = true时才能正确读取,原因其实很简单,因为只有 groupBy = true 时才会聚合曲线;而使用Tags时没有这一问题。 - 通过配置Variables中变量指定,例如
${country}指代country的值,是的,这里无需加上tag_前缀。需要注意的是,当配置变量为K-V对时,这种方法读取的是Value。
总结
基于OpenTSDB,通过我们的Metrics打点,在了解了Filters原理以及使用方法后,我们便能够很好地在Grafana上搭建符合我们需求的监控大盘了。
参考